Sequence-of-returns risk, or sequence risk, is the risk that an investor will experience negative portfolio returns very late in their working lives and/or early in retirement. Sequence-of-returns risk is a significant threat because retirees have little time to make up for losses that are compounded by the simultaneous drawdown of income distributions.
What happens in the market shortly before and after retirement–during the “fragile decade”–is more important than one might think. If retiring during or before a market downturn, the combination of withdrawals and poor performance can quickly deplete a retiree’s main source of income and make it difficult to recover. It is important for investors to be protected from a poor sequence of returns during this “fragile decade.” Will they be forced to retire and begin withdrawing when the market is down? Will poor returns after retirement deplete their nest egg?
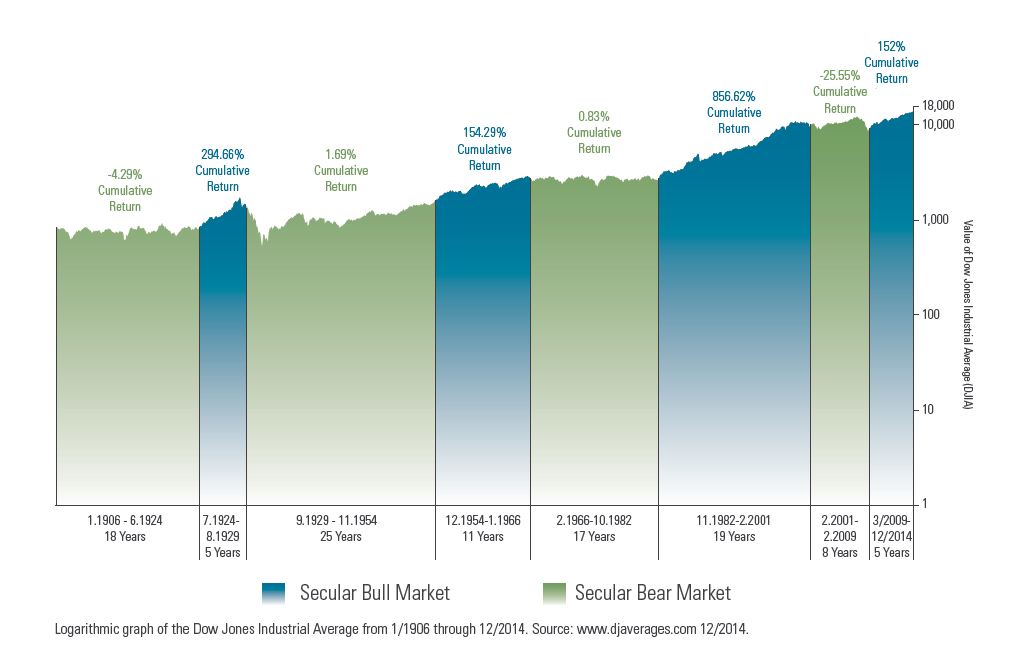
The market has always moved up and down in cycles. In fact, there have been exactly four long-term, or “secular” bull markets and exactly four long-term, or “secular” bear markets in history. For our purposes, a secular market trend is defined as a long-term event of 5 to 25 years that is composed of a series of primary trends. A secular bear market is comprised of smaller bull markets and larger bear markets; a secular bull market is comprised of larger bull markets and smaller bear markets. When it comes to retirement, investors want the confidence of knowing they’re prepared for both secular bull markets and secular bear markets.
The chart below shows sequence-of-returns risk in action. Even though both investors start retirement with the same amount, and take the same withdrawals, they have very different results. Why? Because of how different the markets perform when their retirements begin.
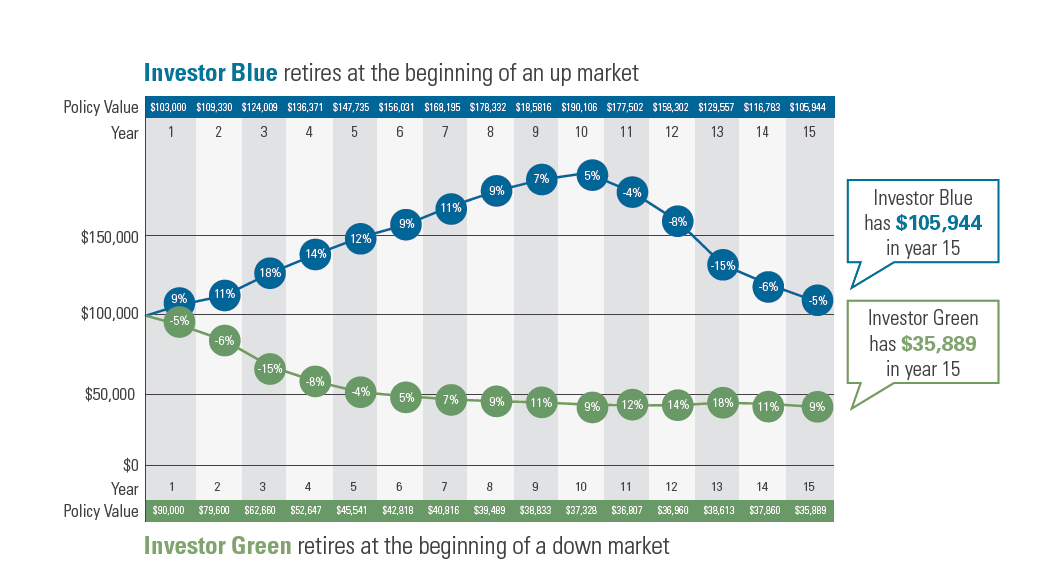
Please note that the hypothetical illustration does not represent the results of an actual investment. It does not reflect any investment fees, expenses or taxes associated with investments. An average annual return of 4% is reflected for both investors. Annual withdrawals of $5,000 are taken at the end of each year.
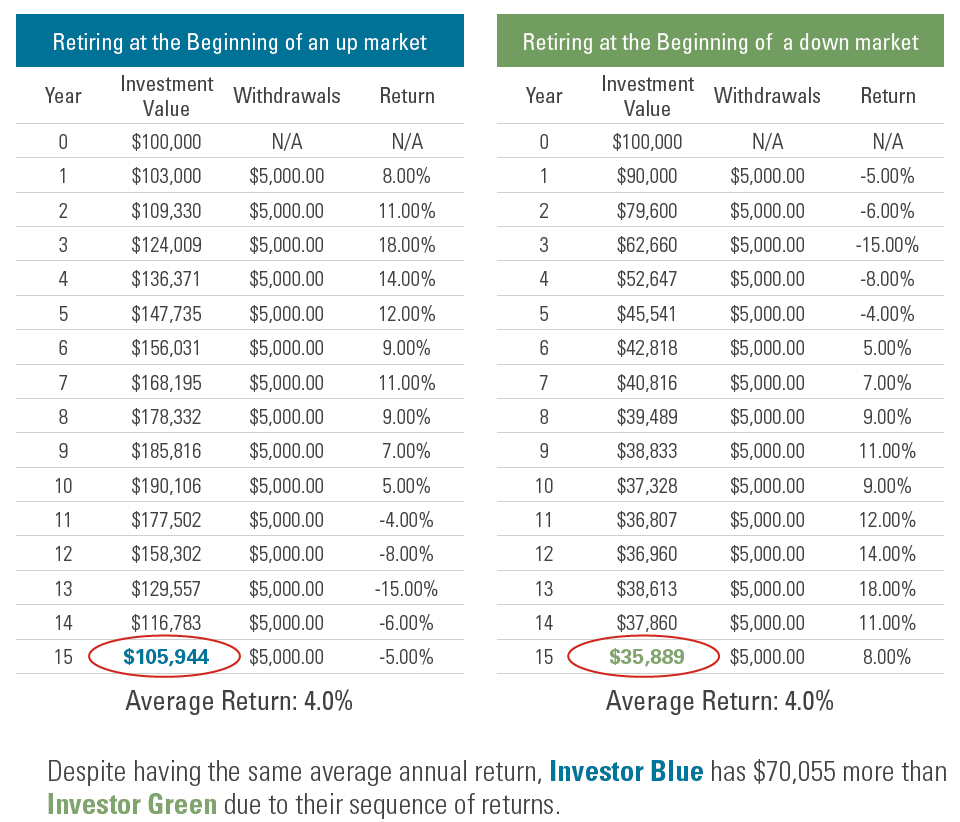
Not only do different market cycles affect investment performance, the order in which these cycles
occur also matters. The tables below show their annual returns over a 15-year period are the same. What’s different is the order of the returns, which has been reversed. Notice how much their investment value changes.
Many economists like Bill Sharpe agree that lifetime income streams provided by annuities can help retirees minimize waste in retirement and protect against longevity risk and sequence-of-returns risk. These lifetime income streams may be created with variable annuities and other annuities offering guaranteed lifetime withdrawal benefits (GLWB), or via immediate or deferred annuities.